
ニュース

China Furniture Sourcing Agent: Roles for High-End Buyers
China Furniture Sourcing Agent Roles for High-End Buyers What a China Furniture Sourcing Agent Actually Does for High-End Buyers Every finished luxury room sits on

Stop Leaving Money on the Table — Master Your True Import Costs Before Your Next Factory Order

There is a calculation most furniture distributors, showroom owners, and design professionals never complete before they commit to a factory order. They know the FOB (Free On Board — factory price at the port of export) quote. They have a rough sense of freight costs. They assume duties will be “around 10%.”
By the time the shipment clears customs and lands at their warehouse, the landed cost — the true, all-in cost per unit — is anywhere from 35% to 70% higher than their original estimate. That gap is where margin dies.
US furniture imports topped $72 billion in 2024. The buyers profiting in that market are not necessarily the ones with the lowest factory prices. They are the ones who calculate every cost layer before placing the order — not after goods arrive.
This guide gives you the exact framework, calculator methodology, and supplier evaluation system those buyers use.
A factory quote is a starting point. It tells you one number: what the manufacturer charges for production plus loading onto a vessel. It tells you nothing about what happens next.
Every step between factory gate and your warehouse floor adds cost — and most of those steps have multiple sub-costs that first-time and even experienced importers routinely underestimate or miss entirely.
Here is what the actual cost stack looks like on a mid-range upholstered dining chair with an FOB price of $95:
| Cost Component | Amount Per Unit | % of Total |
|---|---|---|
| FOB Factory Price | $95.00 | 51.4% |
| Ocean Freight (LCL, China–US West Coast) | $18.50 | 10.0% |
| Marine Insurance | $1.90 | 1.0% |
| US Import Duty (6% base MFN) | $5.70 | 3.1% |
| Section 301 Tariff (25% on Chinese goods) | $23.75 | 12.8% |
| Port Fees & Customs Broker | $6.20 | 3.3% |
| Third-Party Inspection (amortised per unit) | $4.80 | 2.6% |
| Inland Freight to Warehouse | $8.40 | 4.5% |
| Dwell Time & Port Storage (average) | $3.20 | 1.7% |
| Currency & Payment Fees | $2.10 | 1.1% |
| Contingency Buffer (10%) | $16.95 | 9.2% |
| True Landed Cost Per Unit | $186.50 | 100% |
That $95 chair costs $186.50 by the time it is in your warehouse — a 96% uplift on the quoted price. A showroom operator pricing that chair at a 45% margin on the FOB price is actually selling below cost.
A mid-size furniture distributor in the Southeast US had been sourcing upholstered seating from a Guangdong factory for two years. Their pricing model was built on FOB price plus a flat 40% “import and logistics” estimate they had applied from their first order and never updated.
In Year 2, freight rates had increased by 34%, Section 301 tariffs had expanded to cover their product category, and port dwell times had added an average of 8 extra storage days per shipment.
When a consultant rebuilt their landed cost model from scratch, the actual import cost was running 22% higher than their flat estimate. Across their annual $215,000 sourcing volume, they had been systematically underpricing inventory — absorbing $47,300 in costs they hadn’t accounted for.
The fix was not a new supplier. It was a correct cost model. Within two order cycles, they had adjusted pricing, renegotiated one freight lane, and identified that one product line was genuinely unprofitable at current volume — and discontinued it.
Underpriced inventory is invisible margin erosion. You sell the piece, the transaction looks profitable on the top line, and the actual margin damage only surfaces when you reconcile accounts receivable against total procurement costs at quarter-end — by which point you have already committed capital to the next order at the same incorrect pricing.
The reverse problem is equally damaging: if your cost model consistently overestimates landed cost, you price out of competitive projects. Interior designers and hospitality fit-out teams comparing multiple furniture suppliers have lost projects to competitors who — correctly — knew their costs were lower and priced accordingly.
Accurate landed cost calculation is not just a margin protection tool. It is a competitive intelligence asset.

Landed cost is the total cost of a product from factory origin to your warehouse, including every expense incurred along the way. It is the only number that accurately represents what you paid for a unit of inventory.
The formula:
$$\text{Landed Cost} = \text{FOB Price} + \text{Freight} + \text{Insurance} + \text{Duties & Tariffs} + \text{Port & Broker Fees} + \text{Inspection} + \text{Inland Freight} + \text{Storage} + \text{Currency & Payment Costs}$$
Standard accounting-based landed cost formulas typically capture freight, duty, and brokerage — the costs that appear on invoices. What they miss: dwell time storage charges (which arrive separately and weeks after the shipment), amortised inspection costs (often logged as a general operational expense), tooling fees spread across small order quantities, and the cost of currency conversion on payment dates versus quote dates.
These invisible costs collectively represent 8–15% of true landed cost for most furniture importers.
The gap between FOB quote and actual delivered cost exists because the quoting process and the shipping process involve entirely different variables, different parties, and different timelines. A factory quote is fixed at negotiation. Freight rates, tariff classifications, port congestion fees, and currency rates are live variables that change between order placement and delivery.
Current effective tariff rates on furniture imports into the US (as of mid-2025) illustrate the scale of the issue:
| Origin Country | Effective Tariff Rate (Furniture) | Key Notes |
|---|---|---|
| China | ~35% effective rate | Base MFN (6%) + Section 301 (25%) + additional tariffs |
| Vietnam | ~10% effective rate | Base MFN; subject to potential increases |
| Indonesia | ~10% effective rate | Base MFN; wood certification requirements apply |
| Mexico | ~0% (USMCA eligible) | Compliance documentation required |
Source: Tariffs Tool — Furniture by Country, 2025 rates
A buyer sourcing from China who quotes clients based on the base 6% MFN duty and ignores the Section 301 25% tariff layer is absorbing a 25-percentage-point cost error on every shipment. On a $50,000 order, that is a $12,500 hidden cost per shipment.
Incoterms (International Commercial Terms — standardised trade terms that define who pays what and when in an international shipment) determine your cost control and risk exposure:
For most furniture distributors and showroom operators placing orders above $15,000, FOB delivers the best combination of cost control and supply chain visibility.
A comprehensive breakdown of all Incoterms options is available at the U.S. International Trade Administration — Know Your Incoterms.
Request quotes from a minimum of 3 factories for every new product category. Use a standardised RFQ (Request for Quotation) template that specifies: dimensions, materials, finish, MOQ, lead time, and requested Incoterm. This creates a directly comparable data set. A quote more than 18–20% below the average of comparable factories should trigger a detailed investigation — not an immediate order.
| Shipping Method | Cost Range (China–US) | Transit Time | Best For |
|---|---|---|---|
| LCL Ocean (per CBM) | $130–$180/CBM | 28–40 days | Orders under 10–12 CBM |
| FCL 20-foot container | $4,600–$5,600 | 22–30 days | Orders 14–25 CBM |
| FCL 40-foot high-cube | $4,600–$5,700 | 22–30 days | Orders 25–65 CBM |
| Air Freight (per kg) | $5–$12/kg | 5–10 days | Urgent restocks, small high-value pieces |
Source: Sino-Shipping China–USA Freight Rates, August 2026
LCL (Less than Container Load — your cargo shares a container with other shippers) has a higher per-CBM cost than FCL (Full Container Load — your goods fill an entire container) but no minimum volume requirement. The break-even point where FCL becomes cheaper than LCL typically sits around 10–12 CBM for most China–US lanes.
Beyond freight, a typical US import incurs: Customs broker fee ($150–$400), ISF filing fee (Importer Security Filing — $35–$50), port handling/THC ($150–$350), and AMS/B/L documentation ($50–$120). These charges collectively add $385–$920 per shipment, which must be amortised across your unit count.
HS codes (Harmonised System codes — the international classification system used to identify traded goods for customs purposes) determine your duty rate. The most common furniture HS codes for US imports:
| Product Type | HS Code | Base MFN Duty |
|---|---|---|
| Upholstered wooden seats | 9401.61 | 0% (+ Section 301 tariff) |
| Non-upholstered wooden seats | 9401.69 | 0% |
| Wooden bedroom furniture | 9403.50 | 0% |
| Wooden office furniture | 9403.30 | 0% |
| Other wooden furniture | 9403.60 | 0% |
| Metal furniture (non-household) | 9403.10 | 0% |
| Upholstered base rate (general) | varies | 3.8–6% |
Note: These base MFN rates are supplemented by Section 301 tariffs on Chinese-origin goods, currently adding 25–35% on most furniture categories. For a current comprehensive lookup, the HFA’s Furniture Import Duties Guide provides US-specific guidance.
Buyers sourcing from Vietnam and Indonesia benefit from significantly lower effective tariff rates than Chinese-origin goods. Vietnam-origin furniture currently carries approximately a 10% effective rate, compared to ~35% for equivalent Chinese-origin pieces. To claim preferential origin treatment, you need a valid Certificate of Origin (Form E for ASEAN countries, where applicable) from your supplier — this is a document your supplier must formally obtain and cannot be generated retrospectively.
Industry data from furniture quality control firms indicates that comprehensive inspection protocols reduce quality-related issues by up to 85%. According to statistics cited by The Inspection Company, 42% of wood furniture rejections stem from poor sanding or uneven staining alone — defects that are entirely visible and catchable at a pre-shipment inspection, but invisible once goods are packed into containers.
Third-party inspection costs for furniture:
| Inspection Type | Cost Range | Best Applied |
|---|---|---|
| Pre-Shipment Inspection (PSI) | $280–$500/man-day | All orders above $10,000 |
| During Production (DUPRO) | $280–$500/man-day | Orders above $25,000 or custom pieces |
| Container Loading Supervision | $200–$350/visit | High-value or large-volume FCL orders |
| Full Factory Audit | $800–$2,500 | New supplier qualification |
For an order of 200 dining chairs at $186 landed cost ($37,200 total), a 5% defect rate represents $1,860 in defective inventory. A $450 pre-shipment inspection that catches those defects before shipment has an ROI of more than 4:1 — before accounting for the return shipping, rework, client relationship damage, and replacement lead time that a post-delivery defect claim triggers.
Inspection is not a discretionary add-on. It is a line item in your landed cost calculation, entered at the order commitment stage. Amortise the inspection fee across your unit count: a $450 inspection on a 200-unit order adds $2.25 per unit — a number that must be in your pricing model from day one.
Dwell time is the period a container spends at a port terminal before pickup. Most US ports offer 3–5 free days after container availability. Beyond that, demurrage (charges for keeping a container at the terminal) typically runs $75–$200 per container per day depending on the port and shipping line.
A container sitting at a congested port for 14 days past the free period accumulates $1,050–$2,800 in demurrage charges alone — a cost that often arrives as a surprise invoice weeks after the goods have already been delivered.
Mitigation: coordinate with your customs broker to file entry paperwork 3–5 days before vessel arrival, arrange inland pickup within 24–48 hours of container availability notification, and confirm terminal release procedures with your freight forwarder before the vessel departs origin.
Standard cargo insurance (All-Risk cover) for furniture typically costs 0.3–0.8% of the declared shipment value (CIF value). On a $40,000 shipment, this represents $120–$320 — a cost that is routinely forgotten in landed cost calculations and that is non-negotiable on any order above $10,000.

This tutorial walks through a complete landed cost calculation for an imported furniture order — covering factory price, freight, duties, inspection, and margin analysis. Essential viewing before your next order.
Start with three inputs: FOB unit price, order quantity, and any tooling or sample costs that need to be amortised. If your factory has a $300 sample fee and a $600 tooling charge for a new design, and your order quantity is 150 units, add $6 per unit to your base factory price before any other calculations.
MOQ (Minimum Order Quantity — the smallest production run a factory will accept) significantly affects per-unit economics. A factory quoting $95 FOB with a 300-unit MOQ versus $108 FOB with a 50-unit MOQ: at face value, the 300-unit option appears cheaper. But the cash committed ($28,500 vs. $5,400 at FOB level), the sell-through timeline, and the inventory carrying cost may make the higher-unit-price, lower-MOQ option more profitable.
Standard payment terms — 30% deposit on order confirmation, 70% before shipment — mean your capital is committed for approximately 8–14 weeks before revenue is generated. On a $37,200 landed cost order, your 30% deposit of $11,160 is tied up from day one, and the remaining $26,040 leaves your account before the goods arrive.
Build this cash flow cycle into your analysis. The working capital cost of a 90-day inventory cycle — even at a modest 6% annual cost of capital — adds approximately 1.5% to your effective landed cost per unit.
Once you have your FOB price and Incoterm confirmed, calculate freight per unit:
$$\text{Freight Per Unit} = \frac{\text{Total Freight Cost}}{\text{Number of Units}}$$
For a 150-unit dining chair order occupying 8.5 CBM at $150/CBM LCL: total freight = $1,275. Divided by 150 units = $8.50 per unit in freight cost. Add insurance, port fees, and broker charges (typically $500–$700 total for a standard LCL shipment), and total logistics cost per unit reaches approximately $12–$16.
The calculation is straightforward. If your order fills less than 10–12 CBM, LCL consolidation is almost always cheaper. Above that threshold, booking a 20-foot container typically delivers a lower per-CBM cost. For orders above 25 CBM, a 40-foot high-cube container offers the best unit economics and reduces damage risk from consolidated shipping.
Before placing any order on a new product category, confirm the correct HS code and current duty rate. Resources for HS code research:
Enter your confirmed duty rate as a percentage of FOB value. On a $95 FOB chair from China with a ~35% effective rate, duty cost = $33.25 per unit — the single largest cost component outside the factory price itself.
| Sourcing Origin | FOB Price (Typical) | Effective Tariff | Landed Cost Impact |
|---|---|---|---|
| China | $95 | ~35% | +$33.25 duty on $95 FOB |
| Vietnam | $108 | ~10% | +$10.80 duty on $108 FOB |
| Indonesia | $112 | ~10% | +$11.20 duty on $112 FOB |
At first glance, China’s lower FOB price looks attractive. Run the full landed cost calculation and the picture changes: Vietnam-sourced furniture at a higher FOB price can deliver a lower landed cost when the 25-percentage-point tariff difference is applied. NAFOCO’s Vietnam sourcing analysis notes that landed costs from Vietnam are typically 20–22% lower than equivalent Chinese imports in the current tariff environment.
For a standard furniture order:
| Order Value | Recommended Inspection Level | Estimated Cost |
|---|---|---|
| Under $10,000 | PSI (1 inspector, 1 day) | $280–$400 |
| $10,000–$25,000 | PSI + Container Loading Supervision | $500–$750 |
| $25,000–$60,000 | DUPRO + PSI | $800–$1,200 |
| Above $60,000 | Full audit + DUPRO + PSI | $1,500–$3,000 |
Enter your inspection cost into the calculator as a flat fee, then divide by unit count for the per-unit line item. At $450 for a PSI on 150 units, that is $3 per unit — a cost that must be reflected in your pricing.
Add a defect rate reserve to your landed cost calculation. If your supplier has a historical defect rate of 4%, budget 4% of your unit cost as a quality reserve:
$$\text{Defect Reserve Per Unit} = \text{Landed Cost Per Unit} \times \text{Historical Defect Rate}$$
On a $186.50 landed cost unit with a 4% defect rate, your defect reserve = $7.46 per unit. This reserve funds rework, replacements, or client credits — and should be built into your pricing, not absorbed from margin.
Scale affects per-unit landed cost significantly, primarily through fixed-cost amortisation and freight rate negotiation:
| Scenario | Units | FOB Total | Freight Total | Duty Total | Inspection | Total Landed | Per Unit |
|---|---|---|---|---|---|---|---|
| Base order | 150 | $14,250 | $1,950 | $4,988 | $450 | $24,150 | $161 |
| Mid-scale order | 500 | $47,500 | $5,200 | $16,625 | $800 | $77,025 | $154 |
| Volume order | 1,000 | $90,250 | $9,100 | $31,588 | $1,200 | $144,575 | $145 |
Assumptions: Vietnam origin, 10% effective duty, $95 FOB, LCL to FCL transition at 500 units. Numbers indicative.
The per-unit landed cost drops from $161 at 150 units to $145 at 1,000 units — an 11% reduction driven primarily by freight efficiency and inspection amortisation. This is the real economic argument for volume consolidation.
A completed landed cost calculation should export three outputs: (1) landed cost per unit by cost component, (2) total shipment cost summary, and (3) recommended retail/wholesale price at your target margin. These outputs integrate directly into accounting systems, pricing sheets, and client quotation templates — eliminating the manual recalculation that introduces errors.

A factory that accepts your deposit and then encounters financial difficulties during production is one of the most damaging scenarios in furniture importing — not because it happens often, but because the recovery process is slow, expensive, and rarely fully successful.
Indicators of financial stability to verify before placing any deposit:
| Certification | What It Confirms | Why It Matters for Your Business |
|---|---|---|
| ISO 9001 | Quality management systems | Baseline indicator of documented processes |
| FSC (Forest Stewardship Council) | Responsible timber sourcing | Required for LEED projects and EU/UK markets |
| OEKO-TEX Standard 100 | Textile safety, chemical compliance | Required for US and EU upholstered furniture |
| CARB Phase 2 | Formaldehyde emissions compliance | Required for California; best practice for all US imports |
| EN 12520 / EN 16139 | European seating strength and durability | Required for hospitality and commercial seating in EU markets |
A factory requesting 70% or 100% upfront on a first order — before sample approval — is a significant red flag. Standard first-order terms run at 30% deposit, 70% before shipment. A factory that cannot operate on these terms may be experiencing cash flow stress that will affect your order.
Conversely, a factory that immediately accepts 20% deposit and 60-day post-shipment terms on a first order is either desperate for the order or has no intention of honouring the terms. Neither scenario is good.
Reliable factories know their production capacity, lead times, and MOQ requirements precisely. Vague responses — “usually around 6–8 weeks, depends” with no further detail — indicate either poor production management systems or a trading company that needs to place orders with factories it doesn’t directly manage. Both create delivery risk.
Track delivery performance against committed dates starting from your first order. A factory with a consistent record of 7–10 day delays may seem manageable — until you are running a hotel opening timeline with zero schedule buffer. Suppliers who deliver on time on small orders are far more likely to deliver on time when the stakes are higher.
Log defect rates after every receiving inspection. A supplier running at 6% defect rate on your third order is not improving — that is a systemic quality problem, not an isolated incident. Track response time to quality concerns: a supplier who responds to defect documentation within 48 hours with a root-cause analysis is a fundamentally different business partner than one who goes quiet for two weeks.
| Criterion | Weight | Scoring (1–5) |
|---|---|---|
| Years in operation (own factory) | 10% | |
| Product category match | 10% | |
| Verified trade references (called, not just listed) | 15% | |
| Certifications held (ISO, FSC, OEKO-TEX, etc.) | 10% | |
| Technical drawing capability (sample provided) | 10% | |
| Communication responsiveness (<24h) | 8% | |
| Sample quality vs. specification | 15% | |
| Lead time precision (specific dates provided) | 7% | |
| Payment terms flexibility | 5% | |
| Willingness to accept third-party inspection | 5% | |
| Factory visit/video tour available | 5% | |
| 100% | Total: /500 |
Minimum passing score for a first-order commitment: 350/500. A supplier scoring below this threshold requires either additional vetting or should be declined.
Download the complete template — including all 30+ evaluation criteria, a scoring methodology, and a supplier comparison matrix — at JL&C Furniture’s sourcing resources page.
A distributor comparing dining chair options receives two quotes:
Factory B looks $6 cheaper at FOB level. Running a full landed cost analysis:
| Cost Component | Factory A (Vietnam) | Factory B (Indonesia) |
|---|---|---|
| FOB | $88.00 | $82.00 |
| Freight (per unit, LCL) | $16.50 | $18.20 |
| Insurance | $1.76 | $1.64 |
| Duty (10% of FOB) | $8.80 | $8.20 |
| Port & Broker (amortised) | $5.20 | $5.20 |
| Inspection (amortised) | $3.00 | $4.50 |
| Dwell & Storage (est.) | $2.80 | $4.10 |
| Defect Reserve (2% vs. 5%) | $3.73 | $6.19 |
| Total Landed Cost | $129.79 | $130.03 |
The $6 FOB advantage of Factory B is entirely erased by higher freight costs (Indonesia-US lanes are longer), higher inspection cost (due to no certifications, inspection depth is increased), higher estimated dwell time, and a higher defect reserve reflecting the absence of quality certification.
Factory A’s 45-day lead time vs. Factory B’s 55-day lead time represents 10 fewer days of capital committed per order cycle. Over four orders per year, that is 40 fewer days of working capital tied up — a cash flow advantage worth approximately 1.5–2% of annual sourcing volume in real capital cost terms.
An interior designer sourcing 35 custom armchairs for a 50-room boutique hotel project faces a common dilemma: the factory’s MOQ is 50 units. Options:
Running the landed cost calculation for each scenario makes the decision quantitative rather than instinctive. The small-batch premium is typically $8–$18 per unit — on a $950 custom armchair, this is less than 2% of landed cost. The inventory carrying cost of 15 unsold units at $620 landed cost is $9,300 of frozen capital for an uncertain period.
When a hotel operator challenges a designer’s furniture pricing, a complete landed cost breakdown — factory price, freight, duty, inspection, and handling — provides a transparent, defensible cost structure. Clients who understand why premium sourcing costs what it costs are less likely to push back on pricing and more likely to trust the design professional’s judgment on quality recommendations.
Scaling from 2 to 5 suppliers introduces cost complexity: each supplier has different FOB prices, different origin countries (different duty rates), different freight lanes, and different historical defect rates. Without a standardised landed cost model applied consistently across all suppliers, profitability comparisons become meaningless.
The solution is a supplier cost card — a single-page landed cost summary for each supplier, updated quarterly — showing: average FOB price by product category, effective duty rate, average freight cost, inspection cost, defect reserve, and net landed cost vs. closest competitor.
After running supplier cost cards for all five suppliers, showroom owners often discover that 1–2 suppliers who appeared competitive on FOB price are actually their least profitable sources once full landed cost and defect reserve are applied. This analysis typically drives either renegotiation or supplier rationalisation — and rarely requires finding new suppliers. It requires knowing the real numbers on the existing ones.
A container stuck at the Port of Los Angeles for 18 days past the free period — not unusual during peak shipping season — accumulates approximately $1,350–$3,600 in demurrage at standard rates. Add $500–$800 in extended customs examination fees if the container is flagged for inspection, and the total unexpected cost reaches $2,000–$4,400 on a single shipment.
Build a dwell time contingency of $200–$500 per shipment into your landed cost model as a standard line item. It will not always be needed — but the months it is will not destroy your margin analysis.
A buyer importing upholstered seating from China classified their products under a general furniture HS code carrying a lower duty rate, not recognising that the specific product construction triggered a different classification with a higher Section 301 rate. The misclassification went undetected for three shipments. When flagged during a CBP (US Customs and Border Protection) review, the back-duties, interest, and penalties totalled over $28,000.
HS code classification for furniture is not intuitive. A wooden chair with upholstered seat pad classifies differently from a fully upholstered armchair, which classifies differently again from a chair with metal legs. Always confirm classification with a licensed customs broker before your first shipment of any new product.
Importing furniture components (legs, frames, upholstery panels) separately and assembling domestically can reduce effective duty rates in some categories. This “tariff engineering” approach requires careful legal compliance review — but for high-volume buyers in categories with large Section 301 tariff exposure, the savings can be material.
A defect rate of 5% on a 300-unit, $186 landed cost order represents $2,790 in defective inventory — plus return freight, replacement lead time, and the client relationship cost of a delayed or incomplete delivery. A $450 pre-shipment inspection that prevents this outcome has a 6.2:1 ROI on that single order. Intertek’s furniture inspection services provide global coverage for furniture manufacturers across Asia.
$$\text{Inspection ROI} = \frac{(\text{Defect Rate} \times \text{Total Landed Cost}) – \text{Inspection Cost}}{\text{Inspection Cost}}$$
For a $40,000 landed cost shipment with a 4% historical defect rate and a $500 inspection cost: potential defect exposure = $1,600. Inspection ROI = ($1,600 − $500) / $500 = 2.2:1 minimum — before client relationship value is factored in.
The gap between a factory’s FOB quote and your true landed cost is not a rounding error. It is a structured cost gap of 35–70% for most furniture categories, driven by freight, duty, inspection, and logistics charges that the factory quote does not include and was never intended to include.
Freight rates change monthly. Duty rates can shift with 30 days’ notice under trade policy changes. Currency rates move between order placement and payment date. Port congestion is unpredictable. A 10–15% contingency buffer on your calculated landed cost is not pessimism — it is the difference between a margin that holds and one that evaporates when any single variable moves.

Total Cost of Ownership (TCO) is the complete financial cost of a supplier relationship over time — including not just unit price, but defect rates, lead time reliability, communication cost, rework, and relationship management overhead.
A factory with a $5 lower FOB price but a 7% defect rate (vs. a vetted supplier’s 2%) costs more on every order above approximately 150 units — before any of the non-monetary costs of quality problems are counted.
The four-variable framework for supplier evaluation:
| Factor | Weight | What to Measure |
|---|---|---|
| Price (landed cost) | 35% | Full landed cost per unit, not FOB |
| Quality | 30% | Historical defect rate, certification level |
| Lead time | 20% | Average days from order to shipment, consistency |
| Reliability | 15% | On-time delivery rate, communication responsiveness |
A supplier scoring well on all four factors at a slightly higher landed cost will almost always outperform a price-optimised supplier with poor quality and reliability metrics across a 12-month sourcing relationship.
Freight forwarders offer volume discounts at defined thresholds. A buyer committing to 4 FCL shipments per year on the same lane can negotiate a rate 8–15% below spot market. On a $9,000 annual freight spend, that negotiated discount saves $720–$1,350 per year — without changing a single factory relationship.
If you work with multiple factories in the same region (e.g., Guangdong province or Ho Chi Minh City metro), consolidating multiple smaller orders into a single container saves freight cost and reduces per-unit port charges. A skilled freight forwarder can manage multi-factory consolidation — but requires advance coordination and a consolidated loading schedule.
A sourcing dashboard should display, at minimum: landed cost by supplier (updated each order), gross margin by product category, on-time delivery rate by supplier, and defect rate trend by supplier. These four metrics, tracked over 12 months, provide the intelligence basis for every significant sourcing decision.
It is common for furniture importers to discover — once a proper landed cost dashboard is in place — that 20% of their product lines account for 60–70% of total gross margin, while another 30–40% of lines are operating below acceptable margin thresholds. This 80/20 reality drives rationalisation, renegotiation, or redesign decisions that compound profitability over time.
The team at JL&C Furniture regularly works through this analysis with distribution and design partners — helping identify which product categories represent the strongest margin opportunity in the current sourcing environment and which require a pricing or supplier strategy adjustment.
Q1: What’s the difference between FOB, CIF, and DDP, and which should I negotiate?
FOB (Free on Board) means you pay for freight and insurance after goods leave the factory — giving you full control of carrier selection and cost, but more administrative responsibility. CIF (Cost, Insurance, Freight) means the factory covers freight and minimum insurance to your destination port — more convenient, but the supplier typically marks up the logistics cost by 5–12%. DDP (Delivered Duty Paid) means the factory handles everything including import duties — the simplest option but the highest unit cost. For most B2B furniture importers placing orders above $15,000, FOB offers the best combination of cost control and supply chain visibility.
Q2: How much should I budget for tariffs on imported furniture?
Tariff rates depend on HS code classification, origin country, and destination market. As of 2025, furniture from China carries approximately a 35% effective rate in the US (base MFN plus Section 301). Vietnam and Indonesia typically run at 10% effective rate. Always verify current rates using the US HTS official lookup and add 2–3% for customs broker fees and documentation costs. Rates can and do change with trade policy — budget quarterly reviews.
Q3: Why does my landed cost keep increasing even when factory prices stay flat?
Freight rates, fuel surcharges, port handling fees, and tariff rates all fluctuate independently of factory pricing. Currency exchange rates also affect effective cost when factories quote in USD but your home currency weakens. A landed cost that looked right 12 months ago may be 10–18% understated today if any of these variables have moved. Quarterly recalculation is the minimum recommended frequency for high-volume product lines.
Q4: Should I always use the cheapest shipping option?
No. Ocean LCL freight is cheapest for most furniture volumes, but extended port dwell time can add $1,500–$4,000 per container in demurrage charges that offset the freight saving. Air freight costs approximately 5–10× ocean rates but eliminates dwell time risk and reduces your working capital committed per cycle. For urgent restocks or time-sensitive project deliveries, the capital efficiency gain from faster air freight may outweigh the rate premium.
Q5: How do I factor in quality control costs when comparing suppliers?
Add your total inspection cost as a flat fee per shipment, then divide by unit count for the per-unit inspection line item. Compare this against your historical defect rate for each supplier: a supplier with a 2% defect rate needs less intensive inspection (lower cost) than one at 6%. Third-party inspection for furniture typically costs $280–$500 per inspector-day. For orders above $25,000, budget for both a During Production and Pre-Shipment inspection.
Q6: What financial indicators should I check before committing to a new factory?
Request trade references from 2–3 existing international buyers and call them — not email, call. Ask specifically about payment term adherence, production timeline reliability, and how the factory handled problems when they arose. Request the factory’s business registration documents and verify registration date. Factories demanding 70%+ deposits before sample approval, or unwilling to provide trade references, should be disqualified regardless of pricing.
Q7: How many suppliers should I work with, and how does that affect my landed costs?
3–5 suppliers for your core product categories provides supply redundancy without fragmenting volume to the point where you lose negotiating leverage with any one partner. Managing each supplier relationship has an administrative cost — estimate 2–4 hours per month per active supplier for communication, order tracking, and quality management. The landed cost benefit of additional suppliers (redundancy, competitive tension) must be weighed against this overhead.
Q8: How do I negotiate better payment terms without damaging supplier relationships?
Frame improved payment terms as a function of your order growth, not as a demand. After 2–3 successful orders, raise the conversation: “We’re planning to increase our orders significantly over the next 12 months. To support that growth, we’d like to discuss adjusting our payment terms to [proposed terms]. What would we need to commit to in order to make that work for you?” Factories respond to volume commitments — not to buyers who simply ask for better terms without providing reciprocal value.
Q9: What’s a realistic defect rate I should budget for, and how does it affect my landed cost?
Industry standard for furniture imports from established, ISO-certified suppliers is 2–4% across a mixed product range. Without quality certifications or inspection protocols, real-world defect rates on first orders from unverified suppliers run 8–15%. Build a defect reserve equal to your historical defect rate × landed cost per unit as a standard line item in your landed cost calculation. Track this rate by supplier and use it as a supplier performance metric.
Q10: How often should I re-evaluate my suppliers and recalculate landed costs?
Quarterly at minimum for high-volume product lines. Freight rates change monthly; tariffs shift with trade policy on 30–90 day notice; supplier performance metrics (defect rate, lead time reliability) should be reviewed at the close of every order. An annual comprehensive supplier review — scoring each partner against your full evaluation scorecard — identifies relationships that have degraded in ways that quarterly order-level tracking misses.
Q11: Can I use this calculator for small orders (under 100 units)?
Yes, and you should — particularly because small orders carry disproportionately high per-unit costs. Fixed charges (broker fees, inspection, port handling) are the same whether you order 50 or 500 units. At 50 units, those fixed costs add $12–$20 per unit; at 500 units, they add $2–$4 per unit. The calculator makes this math explicit, which may lead you to consolidate orders, increase quantity, or adjust pricing to clients for small-batch sourcing.
Q12: How do I explain landed costs to clients who only care about the final price?
Show them the value chain, not just the number. For interior designers and hotel fit-out clients: “Here is the factory cost, here is what it costs to ship and import the piece to your project site, here is the quality assurance cost that ensures what we specified is what arrives, and here is our margin for managing the process reliably.” Clients who understand the structure of the cost are far less likely to push back on pricing than those who see only a final number with no context.
Q13: What happens to my landed cost if there’s a currency fluctuation between order and payment?
Currency risk adds 2–5% to landed cost on average when home currency weakens against the factory’s invoicing currency. Model a downside scenario of 5% currency movement when building your pricing. For orders above $30,000, consider negotiating fixed USD pricing with your supplier, or explore currency hedging through your bank for large, predictable annual sourcing volumes.
Q14: How do I handle landed cost calculations for custom or made-to-order furniture?
Custom orders carry higher factory costs, longer lead times, and less room for order quantity optimization. Calculate landed cost on the exact confirmed quantity — no volume discount assumptions. Add a 15–20% contingency for revision costs (tooling changes, sample re-runs) and extend your cash flow timeline by 4–6 weeks versus standard production. For hotel fit-out custom pieces, build these parameters into client contracts at project commencement.
Q15: Can I use this tool to compare domestic vs. imported furniture sourcing?
Yes. Calculate the full landed cost of your import option, then compare it against domestic wholesale price plus your margin. Account for the lead time difference (8–16 weeks imported vs. 2–4 weeks domestic) by calculating the inventory carrying cost of the longer cycle. In most furniture categories, imported landed costs run 40–65% below comparable domestic wholesale prices — but the carrying cost of a 14-week inventory cycle partially offsets that advantage, particularly for capital-constrained showroom operators.
$$\text{Minimum Wholesale Price} = \frac{\text{Landed Cost Per Unit}}{1 – \text{Target Gross Margin}}$$
For a $161 landed cost chair targeting a 40% gross margin: minimum wholesale price = $161 / (1 − 0.40) = $268.33. Setting your wholesale price at $265 compresses your gross margin to 39.2%. Setting it at $280 delivers 42.5%. Knowing your true landed cost means you can price with precision — not guesswork — and defend every price point with a cost structure behind it.
Buyers who present pricing with a cost transparency framework — “here’s what it costs to source, ship, and guarantee this piece” — command greater pricing authority than those who present a price with no context. Design partners and showroom buyers who understand your cost structure are also more likely to absorb small price increases when freight or duty rates change, because they understand why the change is occurring.
A distributor committing to $120,000 in annual purchasing from a single factory occupies a fundamentally different position than one placing $30,000 in spot orders. The difference shows up in: priority production scheduling, 5–12% per-unit price reductions on volume pricing tiers, extended payment terms (net-30 after shipment rather than 70% pre-shipment), and dedicated production supervisor accountability.
Sharing a 6-month demand forecast with your key suppliers — even an approximate one — allows factories to plan raw material procurement and production scheduling more efficiently. Suppliers who can plan ahead offer: shorter lead times (because materials are pre-purchased), more stable pricing (because they’re not buying materials at spot prices), and better quality consistency (because rushed production is a primary driver of defects).
Explore the full JL&C Furniture product range to identify which product categories are best suited to a collaborative forecasting model.
Adding a new supplier has a real cost: vetting time (5–15 hours), sample approval cycle (3–6 weeks), first-order elevated defect risk, and the learning curve for both parties. This cost is justified when: your current supplier cannot cover a product category you need, you require geographic supply diversification, or your volume has grown to the point where a single supplier cannot reliably fulfil your production needs.
It is not justified by a $3 per unit FOB difference from an unvetted source.
Each additional supplier adds administrative complexity proportional to your order frequency with them. Above 6–8 active suppliers, the management overhead of simultaneous order tracking, quality management, and relationship maintenance becomes a full-time function — not a part-time add-on to a buyer’s responsibilities. Build your operational model before you build your supplier base.
Price confidence is not about being inflexible — it is about knowing the floor below which you cannot go without destroying your business model, and understanding exactly how much room you have above that floor. Buyers with complete landed cost data can respond to competitive pricing pressure with precision: “I can move to $X, which reflects my actual cost structure. Below that, the quality level we’ve committed to isn’t deliverable.”
When a hotel operator or designer pushes back on furniture pricing, the response is not a discount — it is a cost breakdown. If your landed cost is $161 and you are pricing at $268, a $20 discount request cuts your gross margin from 40% to 32.8%. Knowing this number in real time — and being able to explain the cost structure behind it — is a negotiating tool that guesswork-based pricing cannot provide.
A designer requesting a quotation on a 45-unit custom chair for a hospitality project needs a response in hours, not days. With a completed landed cost model for your supplier and freight lane, a new quote is a 15-minute calculation exercise — not a 3-day research project. The speed of your response is itself a competitive signal about your operational professionalism.
When a client asks about a new product category — outdoor teak furniture, modular hospitality lounge pieces, custom headboard collections — you can run a preliminary landed cost estimate in under 30 minutes using your existing cost model framework. This allows you to make fast, data-driven decisions about which product opportunities are worth pursuing before investing in sample development.
A buyer who can articulate exactly how much their freight, duty, inspection, and logistics cost per unit — and how that compares to the supplier’s FOB quote — negotiates from knowledge, not assumption. This precision signals to suppliers that you are a sophisticated, long-term partner who understands the economics of the relationship. It also makes it significantly harder for a supplier to disguise margin-padding in logistics or packaging charges.
Complete landed cost data across your supplier portfolio reveals the true competitive position of each relationship. A supplier who appeared expensive on FOB but delivers low defect rates, short lead times, and reliable logistics may be your most profitable partner. A supplier whose FOB price is 8% lower but whose combined landed cost — after higher freight, higher defect reserve, and longer lead time carrying cost — is 5% higher is not a competitive advantage. It is a liability dressed as a bargain.
This isn’t just a calculator — it is your sourcing intelligence system.
When you know your true landed costs, you stop competing on price alone and start winning on profitability, reliability, and partnership value. The suppliers you choose, the products you source, and the margins you protect all flow from this foundational knowledge.
Furniture distributors, showroom owners, and design professionals who master landed cost analysis don’t just survive price wars — they thrive while competitors struggle. They make faster decisions, negotiate better deals, and build sustainable supplier relationships that compound value over years.
Your complete sourcing intelligence system — the landed cost calculator, the supplier evaluation scorecard, and 30+ years of industry methodology — is available now. The question isn’t whether you need these tools. It’s whether you can afford another order without them.
Ready to reclaim your margins and source with confidence?
Get instant access to:
Download Your Free Landed Cost Calculator & Supplier Checklist →
Your checklist and calculator will be delivered to your inbox within minutes. No credit card required.
| Term | Definition |
|---|---|
| Landed Cost | The total cost of a product from factory to your warehouse, including all freight, duties, inspection, and handling expenses. |
| FOB (Free On Board) | Seller’s responsibility ends when goods are loaded onto the vessel at the export port. Buyer pays all costs from that point. |
| CIF (Cost, Insurance, Freight) | Seller pays freight and minimum insurance to the destination port. Buyer handles customs and inland delivery. |
| DDP (Delivered Duty Paid) | Seller handles everything — production, shipping, import duties, and final delivery. Highest cost, least buyer involvement. |
| Incoterms | Standardised international trade terms (published by the International Chamber of Commerce) that define the responsibilities of buyer and seller in a shipment. |
| HS Code | Harmonised System code — the standardised international classification number assigned to every traded product, used to determine customs duty rates. |
| MOQ (Minimum Order Quantity) | The smallest production run a factory will accept for a given product. |
| LCL (Less than Container Load) | Shipping arrangement where your cargo shares a container with other buyers’ shipments. Lower cost for small volumes; higher per-CBM rate. |
| FCL (Full Container Load) | Your goods fill an entire container. Lower per-CBM cost; less damage risk from consolidation. |
| AQL (Acceptable Quality Level) | A statistical sampling standard defining the maximum acceptable defect rate. AQL 2.5 = no more than 2.5% of sampled units may be defective. |
| PSI (Pre-Shipment Inspection) | A third-party quality audit conducted when goods are fully produced and partially packed, before they leave the factory. |
| DUPRO (During Production Inspection) | Quality check at 30–40% of production completion to catch process deviations before the full order is manufactured. |
| Demurrage | Charges imposed by a shipping line or port when a container is not picked up within the free period after vessel arrival. |
| Section 301 Tariff | US tariffs applied to Chinese goods under Section 301 of the Trade Act of 1974, currently adding 25–35% on most furniture categories. |
| TCO (Total Cost of Ownership) | The complete financial cost of a supplier relationship over time — including unit price, defect rates, lead time cost, and management overhead. |
| FF&E | Furniture, Fixtures & Equipment — the furnishing specification package used in hospitality and commercial interior design projects. |

China Furniture Sourcing Agent Roles for High-End Buyers What a China Furniture Sourcing Agent Actually Does for High-End Buyers Every finished luxury room sits on
How to Vet a China Furniture Sourcing Agent Before Signing A single curved sofa like this goes through dozens of approvals, including frame, foam, fabric

China Furniture Sourcing Agent vs Direct Factory Buying: A Strategic Guide for High-Value Buyers When one project includes 400 hotel rooms, a 20-seat marble dining
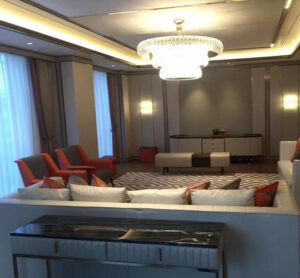
Advanced Tips to Get More from Your China Furniture Sourcing Agent Powerful Strategies for High-Performance Sourcing – Tailored for Elite Buyers, Designers & Operators Your
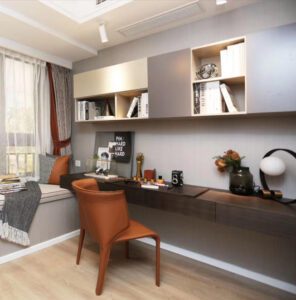
What Wholesale Furniture Suppliers in China Can Offer High-Value Buyers A statement luxury living room — the kind of space that begins with the right

How to Work Better With Your China Furniture Supplier After Ordering A Practical Playbook for High-End Furniture Importers, Interior Designers, FF&E Buyers, Villa Owners, Private