company news

China Furniture Sourcing Agent: Roles for High-End Buyers
China Furniture Sourcing Agent Roles for High-End Buyers What a China Furniture Sourcing Agent Actually Does for High-End Buyers Every finished luxury room sits on

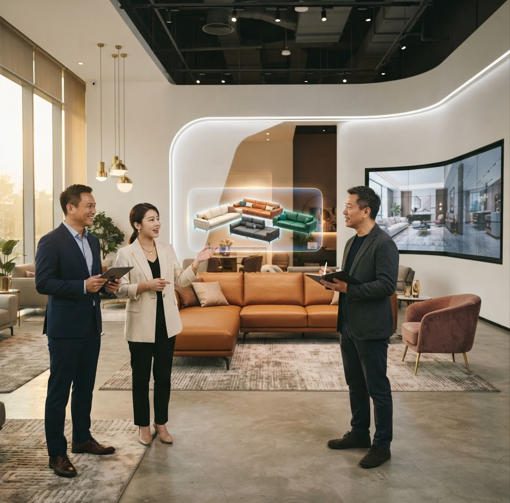
How furniture distributors, showrooms, and interior designers can leverage 3D visualization and AR technology to streamline client decision-making, reduce returns, and accelerate sales cycles across all touchpoints.
 The modern furniture showroom is no longer defined by square footage alone — it extends into every device your client touches before they walk through the door.
There is a specific moment every furniture distributor, showroom director, and interior designer recognizes: the client who spent three weeks researching online, arrived at the consultation with a Pinterest board, an Instagram saved folder, and a folder of screenshots — and then hesitated at the point of order confirmation because they “still couldn’t quite picture it in the space.”
That hesitation has a measurable cost. It extends sales cycles. It multiplies revision rounds. It generates returns. And in a market where a single hotel FF&E (Furniture, Fixtures, and Equipment) project can involve hundreds of SKUs across multiple stakeholders in different cities, it can derail an entire project timeline.
The traditional response — better photography, thicker sample books, more showroom visits — has reached its structural limit. The clients who represent the most valuable B2B opportunities for furniture professionals are simultaneously the most digitally fluent, the most geographically distributed, and the most demanding about decision-support tools. They expect the same quality of product experience online that they get in your best physical space.
Omnichannel visualization technology — 3D product models, augmented reality (AR), interactive digital showrooms, and real-time configurators — is the response to that expectation. And the data on its commercial impact is no longer preliminary: Shopify’s cross-platform analysis shows that products with 3D/AR content achieve 94% higher conversion rates than equivalent listings without it. AR visualization has been shown to reduce furniture return rates by 25–40%, and interactive 3D models reduce the B2B sales cycle by up to 30%.
This guide is written for the B2B professionals who need to understand not just what these tools are, but how to implement them operationally, how to measure their impact, and how to use them to build a competitive position in a furniture distribution market that is moving fast.
The Shift from Traditional Showrooms to Hybrid Sales Models
The furniture industry’s sales model has undergone more structural change in the past five years than in the preceding two decades. The linear funnel — client discovers product, visits showroom, places order — has been replaced by a non-linear journey in which clients move fluidly between digital research, virtual consultation, physical showroom experience, remote specification review, and online order confirmation. The sequence varies by client, project type, and geography.
For B2B furniture professionals, this creates both complexity and opportunity. The complexity is that you must maintain consistent brand presence and product information quality across every touchpoint your client uses. The opportunity is that each digital touchpoint is measurable, scalable, and capable of doing sales qualification work that previously required human time.
Your hotel designer client doesn’t have time to visit your showroom in a different city to evaluate 40 dining chair options for a 200-room property. Your distributor client in a different country needs to present options to their end clients without flying in samples for every specification. Your interior design client needs to walk their residential client through furniture selections before the client’s building is even finished.
These are not edge cases — they are the mainstream operating reality of B2B furniture sales in 2025. The businesses building hybrid sales models that serve this reality are gaining ground on those waiting for the return of the traditional showroom-first flow.
Why Clients Research Digitally but Hesitate at Purchase
The conversion gap in furniture sales — the point between genuine purchase intent and confirmed order — is almost always a confidence gap. Clients who have researched extensively online hesitate not because they lack information, but because the information format they’ve been given doesn’t answer the questions that matter most: Will this scale correctly in my space? Will this color read the same way under my lighting conditions? Will these two pieces work together in the room as I’ve imagined it?
A 2D product photograph against a white background, however high-quality, cannot answer any of these questions. A PDF specification sheet answers the dimensional question technically but does not resolve it spatially. The client’s imagination is doing the heaviest lifting, and imagination is unreliable under uncertainty.
This is the specific problem that 3D visualization and AR solve — not by providing more information, but by providing information in a format that reduces imaginative uncertainty. And the commercial impact of closing that confidence gap is substantial. Studies show that 73% of consumers say AR would help them with purchase decisions, and among those who have used AR for shopping, 98% found it helpful. In B2B furniture contexts, where the stakes per transaction are dramatically higher than consumer retail, this confidence infrastructure is even more commercially valuable.
How 3D Models Transform Product Understanding
A 3D model is not a better photograph — it is a fundamentally different type of product information. A photograph captures one perspective, one lighting condition, one moment. A 3D model provides complete spatial information: the product can be viewed from any angle, at any scale, in any lighting condition, with any material configuration the platform supports.
For furniture distributors and showrooms presenting collections to interior designers, hotel procurement teams, or commercial fit-out specialists, this distinction has direct operational consequences. A designer specifying 15 dining chairs for a restaurant needs to evaluate seat height relative to table height, the visual weight of the back in relation to the space proportions, and whether the upholstery color reads correctly in context. A static image provides one data point; a 3D model provides all of them.
The specification process — the stage at which an interior designer or procurement team translates design intent into confirmed product orders — is where 3D visualization creates the most measurable efficiency gain. Specification approvals that previously required two or three rounds of physical samples or showroom visits can be consolidated into a single digital review session when all parties can interact with accurate 3D models simultaneously.
Building Confidence in Purchasing Decisions
The mechanics of how 3D visualization builds purchase confidence are worth understanding precisely, because they inform how you present these tools to your clients.
When a client interacts with a 3D model — rotating it, zooming into the joinery detail, switching between fabric options — they are performing active evaluation rather than passive observation. Active evaluation generates understanding rather than impression. Understanding produces confidence. Confidence produces commitment.
This is why the conversion impact of 3D visualization is disproportionate to what “better visuals” alone would predict. It is not that the product looks better in 3D — it’s that the client understands the product more completely, which eliminates the uncertainty that was blocking the purchase decision.
For high-value or high-complexity orders — hotel FF&E projects, large commercial fit-outs, bespoke residential commissions — this confidence infrastructure is the difference between a client who commits at the specification stage and one who requests another round of revisions.
Streamlining the Specification Process for Designers
Interior designers represent one of the highest-leverage client relationships in furniture distribution, and they also represent the clients whose workflows benefit most dramatically from 3D visualization integration.
The typical interior design specification workflow involves creating a furniture schedule (a spreadsheet-format document listing every piece, with dimensions, materials, finishes, supplier, and pricing), producing visual presentations for client approval (typically mood boards or rendered space plans), and managing approval iterations until the client confirms. This process, in traditional form, can involve 3–6 rounds of revision and can take 4–8 weeks from initial selection to confirmed order.
3D models that can be directly imported into design software — compatible with SketchUp, AutoCAD, Revit, and other BIM (Building Information Modeling) platforms — eliminate the manual translation step between product selection and visual presentation. When a designer can place an accurate 3D model directly into their space rendering, the visual presentation for client approval is effectively produced as a byproduct of the specification process rather than as a separate deliverable. This can reduce the specification-to-order timeline by 30–50% for experienced users.
JL&C Furniture provides detailed dimensional specifications and product assets across its collections precisely to support this workflow — ensuring that designers and procurement professionals can work with accurate product information from the specification stage through to installation.
 AR visualization in action: placing a full-scale 3D model of a luxury armchair into a real client space via tablet — this is how purchase hesitation disappears before an order is placed.
How AR Allows Clients to Visualize Furniture in Their Actual Environments
Augmented Reality (AR) is the technology that overlays digital 3D objects onto a live camera feed of a real physical space, allowing users to see a virtual furniture piece placed and scaled accurately within their actual room — through their smartphone or tablet screen.
Where 3D visualization answers “What does this product look like?” AR answers “What will this product look like in my space?” This distinction is why AR has a disproportionate impact on the specific confidence gap that blocks furniture purchase decisions.
The spatial accuracy of modern AR furniture tools is practical for commercial use: most smartphone-based AR platforms achieve dimensional accuracy within 2–5% using the device’s built-in sensors. IKEA’s Place app, which pioneered consumer furniture AR, reports 98% size accuracy on compatible devices. For most residential and commercial specifications, this level of accuracy resolves the scale and proportion questions that drive purchase hesitation.
AR as a Solution for High-Value or Custom Orders
The commercial ROI case for AR is most compelling in the high-value order contexts that define B2B furniture work: hotel fit-out projects, large commercial interior specifications, and bespoke residential commissions.
Consider the operational reality of a hotel FF&E procurement process for a 150-room property. The procurement team needs to specify guest room beds, bedside tables, desk chairs, lounge chairs, wardrobes, and additional pieces — multiplied across multiple room types, with different specifications for accessible rooms, suites, and standard categories. The traditional sample-based evaluation process involves requesting and shipping physical samples of each key piece to the project site, which takes time, generates logistics cost, and still only shows individual pieces in isolation rather than in the configured room environment.
AR-based room visualization — where a full virtual room setting can be constructed and viewed at scale in the actual project space — compresses this process dramatically. A hotel design team can evaluate complete room configurations before a single sample is ordered, iterate on material and finish combinations digitally, and arrive at physical sample stage with a confirmed specification rather than an open brief.
Businesses like JL&C Furniture that serve hospitality clients with custom FF&E packages are well-positioned to offer this kind of visualization support as a differentiated service, transforming the procurement process from a prolonged sample-and-revision cycle into a structured digital-first specification workflow.
Practical Implementation Strategies for Your Business
Getting AR into your sales process does not require a bespoke technology development project. The practical implementation path follows a defined sequence:
First, ensure your product catalog has 3D model assets. This is the foundation — AR requires 3D models to work from, so the first investment is in catalog digitization. For most distributors and showrooms, the most cost-effective approach is outsourcing 3D model creation to a specialized studio, prioritizing your top 50–100 products by sales volume. Production costs typically range from $150–$500 per model for furniture, with photorealistic quality models at $500–$1,500 for complex pieces.
Second, select an AR platform compatible with your catalog and your clients’ typical devices. The most widely adopted platforms for furniture visualization are web-based AR (accessible through any smartphone browser without app download, via QR code) and dedicated visualization apps. Web-based AR — delivered via QR code that opens in the client’s phone browser — achieves 2–3× greater user reach than equivalent app-based experiences because it eliminates the installation barrier.
Third, integrate AR access into your existing client touchpoints: product pages on your website, digital catalogs, email proposals, and in-showroom QR codes. The goal is to make AR engagement a natural step in the client’s existing evaluation process, not a separate experience they must actively seek out.
The Architecture of an Effective Digital Showroom
A digital showroom is not a product catalog with better photographs. It is a curated, navigable virtual environment in which clients can discover products in context, evaluate them at multiple levels of detail, configure options, and move toward specification — without being physically present at your facility.
The most effective digital showrooms for B2B furniture professionals share several architectural characteristics. They organize products by design direction and use case (a hotel bedroom configuration, a restaurant seating arrangement, a corporate lounge setting) rather than by product category alone — because clients are specifying for environments, not assembling lists of products. They provide multiple information layers: the contextual room view for inspiration, the isolated 3D model view for detailed evaluation, and the technical specification view for confirmation. And they maintain live inventory and pricing visibility so that a client’s exploration of the showroom produces actionable information rather than aspirational browsing.
Designing for Different User Personas
The B2B furniture digital showroom serves fundamentally different user types simultaneously, and its architecture must accommodate each:
A distributor representative reviewing product options for a client proposal needs fast access to specifications, pricing, and availability — the showroom is a sourcing tool.
An interior designer browsing collections for a project needs visual context, material options, and dimensional accuracy — the showroom is a design development tool.
A hotel procurement team evaluating FF&E options needs to assess commercial durability specifications, customization capabilities, and lead time data alongside aesthetic evaluation — the showroom is a specification and due diligence tool.
A residential client exploring options with a designer’s guidance needs visual inspiration and an intuitive interface — the showroom is an engagement and confidence-building tool.
Building user flows that serve each of these entry points — without creating a cluttered interface that serves none of them well — is the core design challenge of an effective B2B digital showroom.
Measuring Digital Showroom Performance
One of the underappreciated advantages of digital showrooms relative to physical ones is that every client interaction produces measurable data. Which products attract the most views? Which configurations are explored most frequently? Where do users exit the session — at the browsing stage, the detailed product view, or the specification stage?
This behavioral data is strategically valuable beyond digital showroom optimization. Products that attract high view-to-specification conversion rates in the digital showroom are your highest-demand items, and that demand signal should inform your physical inventory decisions, your manufacturer order planning, and your trend communication to clients.
How Visualization Tools Accelerate Decision-Making
The sales cycle compression that 3D visualization enables is not just about client convenience — it has direct financial consequences for your business. A B2B furniture sale that closes in 3 weeks rather than 8 weeks represents 5 weeks of sales team time released for other opportunities, 5 weeks earlier on your cash flow cycle, and 5 fewer weeks of production lead time before your client’s delivery commitment.
The most significant source of sales cycle elongation in furniture distribution is the revision cycle — the back-and-forth email chain that accumulates when clients cannot evaluate options confidently from the information they’ve been given. “Can you send me a photo in a different angle?” “Can we see the fabric in a warmer light?” “Can you show me how it would look with the table we selected?” Every one of these requests adds 24–72 hours to the cycle and generates documentation confusion as specifications accumulate across email threads.
Interactive 3D visualization eliminates most of this revision traffic because it returns control of the evaluation to the client. Rather than waiting for your team to produce alternative views, the client generates them independently — rotating, zooming, switching materials — and arrives at the follow-up conversation with a confirmed preference rather than a request for more information.
This shift from reactive to self-service evaluation reduces email chain depth by an estimated 40–60% in organizations that have implemented visualization tools systematically, and it reduces the time-from-inquiry-to-order-placement by an average of 28 days across B2B furniture distribution use cases.
Supporting Remote Consultations and Virtual Presentations
The geography of B2B furniture sales has expanded significantly. Interior design firms work on projects in cities they don’t have offices in. Hotel developers commission properties on multiple continents simultaneously. Furniture distributors manage client relationships across regional or international territories that make regular in-person visits impractical.
Visualization tools built for screen-sharing — where a sales representative can navigate a 3D product environment in real time during a video call, responding to client requests by rotating models, switching configurations, and pulling up technical specifications — transform the remote consultation from a limitation into a full-fidelity sales experience.
🎥 Watch: Augmented Reality & 3D Visualization in Furniture — Live Demo

A live demonstration of how AR and 3D visualization tools bring furniture collections to life for clients, enabling real-time configuration and spatial placement that closes the confidence gap at the specification stage.
Empowering Your Sales Team with Better Tools
The sales team capability gap is one of the most common implementation failures when furniture businesses adopt visualization technology. The tools are purchased, the catalog is digitized, the platform is live — and the sales team continues to use the same PDF catalogs and email attachments because the technology feels unfamiliar in client-facing situations.
Effective visualization technology adoption requires sales team training that goes beyond feature familiarity. Representatives need to understand the specific situations in which visualization tools are most commercially powerful (complex specifications, remote clients, multi-stakeholder projects, high-value custom orders) and how to introduce the tools into the client conversation in a way that feels like service enhancement rather than a product demonstration.
The training investment is modest: most sales teams reach practical proficiency in 2–4 hours of hands-on practice. The commercial return is substantial — representatives equipped with interactive visualization tools consistently close higher-value orders faster than those relying on static materials.
The Financial Impact of Accurate Product Visualization
 Accurate product visualization at the specification stage means clients confirm an informed decision — not an optimistic assumption. This is what prevents returns.
Furniture returns carry a cost that most businesses calculate incompletely. The visible cost is the reverse logistics: collecting the piece, transporting it back, and restocking it. But the full cost includes restocking labor, potential damage to the piece during return handling (which may require repair or write-down), the production delay while a replacement is manufactured, client relationship friction, and the opportunity cost of a sales team member managing a return rather than generating new business.
For furniture at typical price points in the B2B market — pieces ranging from $500 to $5,000+ per unit — the total cost of processing a return typically represents 25–35% of the item’s value when all components are included. At scale, a 15% return rate on a $500,000 annual order volume represents $18,750–$26,250 in return-related cost before accounting for relationship impact.
AR visualization reduces this cost structure directly. Measured across multiple retail and B2B furniture studies, AR visualization tools reduce return rates by 25–40%. At a 30% return rate reduction applied to the scenario above, that is $5,625–$7,875 of annual return cost eliminated — from a technology investment that typically costs $5,000–$30,000 for catalog digitization of a core product range.
Building Trust Through Transparency
The transparency benefits of visualization technology extend beyond individual transactions. When clients can evaluate material quality, finish accuracy, and dimensional proportions through accurate 3D models, the post-purchase expectation alignment is fundamentally better than when the client imagined the piece from a photograph.
This expectation alignment is particularly critical for custom and bespoke orders — the high-margin segment of B2B furniture distribution. A client who approves a custom upholstered headboard via an interactive 3D model in which they selected the fabric, adjusted the dimensions, confirmed the finish, and viewed the piece in their room context has made an informed decision with clear responsibility. The post-delivery conversation about whether the piece matches the brief is very different when both parties have a documented digital approval record versus when both parties are relying on memories of a verbal description.
The Loyalty Multiplier of Confidence
Clients who experience a purchase process in which they felt supported, informed, and confident at every stage do not just complete that transaction — they return for the next project with higher initial trust, shorter sales cycles, and a disposition to recommend your business to peers.
The relationship between purchase confidence, satisfaction, and repeat business is well-documented in B2B services research: clients who rate their decision-support experience as “excellent” have 3× the repeat purchase rate of those who rate it as “adequate.” Visualization tools are the most scalable investment available to B2B furniture businesses for improving this experience systematically across the client base.
Compatibility with Current E-Commerce and CRM Platforms
The most common concern among furniture businesses evaluating visualization technology is integration complexity. The practical reality is that the visualization platforms designed for furniture distribution have been built specifically to connect with the systems these businesses already use.
Most established visualization platforms (Cylindo, VividWorks, Marxent, iEnhance) offer API connections to major e-commerce platforms (Shopify, WooCommerce, Magento) and can connect to product database formats used by furniture-specific inventory systems. Integration typically takes 2–8 weeks depending on the complexity of your existing system architecture and the data quality of your product catalog.
The most important integration discipline is data consistency: the 3D model for a product must reference the same SKU identifier, dimensions, and specification data as your inventory system. When these are consistent, a client who evaluates a piece in the digital showroom and adds it to a quote is generating an order reference that flows cleanly through to your fulfillment system.
Preparing Your Product Catalog for Visualization
Catalog preparation — the process of creating or commissioning 3D models for your product range and organizing the accompanying specification metadata — is the most significant upfront investment in visualization implementation, and the one that most commonly determines whether an implementation succeeds or stalls.
The practical approach for most distributors and showrooms is to start with your top 50–100 products by sales volume, commission 3D models for these (outsourcing to a 3D studio at $150–$500 per model for standard pieces, $500–$1,500 for complex or highly detailed pieces), and establish a catalog onboarding process so that new products receive 3D assets as a standard requirement — ideally from the manufacturer at the time of product sourcing.
| Catalog Size | Estimated 3D Model Cost | Implementation Timeline | Expected ROI Payback Period |
|---|---|---|---|
| 50 core products | $7,500–$25,000 | 4–8 weeks | 3–6 months |
| 100 products | $15,000–$50,000 | 8–14 weeks | 6–10 months |
| 200+ products | $30,000–$100,000+ | 3–6 months | 10–18 months |
| Full catalog (500+) | $75,000–$250,000+ | 6–18 months | 12–24 months |
Note: ROI payback estimates are based on return rate reduction savings and sales cycle compression alone, and do not include conversion rate improvement or average order value increase contributions.
Training Your Team to Maximize Technology Adoption
Technology adoption failure in B2B furniture businesses almost always traces to insufficient sales team enablement rather than technology problems. The visualization platform works — but if the sales team isn’t using it confidently in client-facing situations, it generates no commercial return.
An effective training program runs in three tiers: a 2-hour foundational session for all client-facing staff covering platform navigation, basic use cases, and common client questions; a 4-hour advanced session for senior sales representatives covering live demonstration skills, AR walkthrough protocols, and integration with the proposal workflow; and monthly 30-minute refresher sessions that review platform updates, share successful implementation examples, and address any challenges.
Standing Out in a Crowded Furniture Distribution Market
The furniture distribution and showroom market is experiencing a structural consolidation. Distributors who compete purely on product range and price are facing pressure from both ends: direct-to-consumer furniture brands that have invested heavily in visualization technology and e-commerce infrastructure from the ground up, and large multi-brand distributors with scale advantages in procurement pricing.
The differentiation opportunity for mid-market B2B furniture professionals lies precisely in the combination of visualization technology and relationship expertise — the capability that neither DTC brands (which lack the B2B relationship model) nor procurement-scale distributors (which often lack service depth for complex specifications) can replicate.
A showroom or distribution business that offers an integrated service combining digital product exploration, AR spatial visualization, in-person consultation for premium tactile evaluation, and expert specification guidance for complex projects is serving a client need that no other model fully satisfies. The technology enables the service; the expertise makes the service irreplaceable.
Capturing Market Share from Competitors
The client segments that respond most strongly to visualization technology are also the most commercially valuable: interior designers managing multi-project pipelines who need efficient specification tools, hotel procurement teams managing complex FF&E projects who need stakeholder-friendly visual communication, and commercial fit-out specialists working across multiple sites who need remote evaluation capabilities.
Identifying these segments within your existing client base and prospecting within them is the highest-leverage growth strategy for visualization technology investment. A single hotel FF&E project won through superior visualization capability — because your team could show the procurement committee an interactive room configuration when competitors were presenting PDF catalogs — can justify an entire year’s visualization technology investment.
Case studies built from these wins become the most credible marketing assets available for the next prospecting cycle, because they demonstrate capability in a language that potential clients recognize from their own operational reality.
Future-Proofing Your Business Model
The trajectory of B2B furniture buying behavior is unambiguous: digital evaluation capability is moving from competitive differentiator to baseline expectation. Gartner research projects that 80% of retail businesses will deploy AR as part of their customer experience strategy by 2025. In sectors with high transaction values and complex specifications — precisely the B2B furniture market — this adoption rate will likely exceed the retail average.
Businesses that implement visualization infrastructure now will have 2–3 years of operational experience, trained staff, and established client workflows before this capability becomes table stakes. That lead time compounds: better visualization data generates better demand intelligence, better demand intelligence generates better inventory decisions, and better inventory decisions generate better margin performance.
Key Performance Indicators to Track
The commercial impact of visualization technology manifests across multiple performance dimensions. Tracking the right metrics from implementation launch ensures you have the data to demonstrate ROI internally and to optimize the program over time.
| KPI | Baseline to Establish | Target Direction | Measurement Method |
|---|---|---|---|
| Conversion rate (inquiry to order) | Last 12-month average | +20–40% | CRM attribution |
| Average order value | Last 12-month average | +10–25% | Order reporting |
| Sales cycle length (days) | Last 12-month average | -25–40% | CRM timestamps |
| Return rate | Last 12-month average | -25–40% | Order/return records |
| Customer satisfaction score | Establish at launch | +15–30% | Post-delivery survey |
| Digital showroom engagement | Establish at launch | Time-on-site, product views | Platform analytics |
| AR session completion rate | Establish at launch | >60% completion | Platform analytics |
Establish your baseline metrics before launch. Without a pre-implementation baseline, you cannot isolate the impact of the technology from other business changes. The most common measurement mistake is implementing visualization tools at the same time as a product refresh or sales team restructuring — which makes it impossible to attribute performance changes specifically to the technology.
Building the Business Case for Continued Investment
The financial narrative for visualization technology investment in B2B furniture distribution is built on three components: return rate reduction (a direct cost saving with a specific dollar value per unit), sales cycle compression (a capacity multiplier that allows the same sales team to manage more concurrent opportunities), and conversion rate improvement (a revenue multiplier on the inquiry volume you already have).
For a mid-size distributor with $2 million in annual order volume, a 15% return rate, and a 60-day average sales cycle, realistic performance improvements from visualization technology implementation (30% return rate reduction, 25% conversion rate improvement, 30% sales cycle compression) generate an estimated $120,000–$180,000 in combined annual financial benefit — against a total technology and catalog investment of $30,000–$80,000 in Year 1.
Phase 1 — Assessment and Strategy Development
Begin with an honest audit of your current technology landscape: what product information assets do you have (photography quality, existing 3D models, specification documentation), what client touchpoints currently exist (website, catalog, showroom, email), and which client segments represent the highest-priority visualization use cases.
Define 3 specific business objectives for the implementation — for example: reduce return rate by 25%, decrease average sales cycle from 45 to 32 days, and increase conversion rate for hotel FF&E inquiries by 30%. These objectives determine which products to prioritize, which platforms to evaluate, and which KPIs to track.
Phase 2 — Vendor Selection and Integration
The visualization platform vendor selection should be evaluated on: furniture industry specialization (not all visualization platforms are built for the specific rendering and configuration requirements of furniture), integration capability with your existing systems, pricing model (per-product, per-user, or transaction-based models have very different unit economics at different catalog sizes), and the quality of their customer onboarding and support.
Request a pilot project covering 10–20 of your products before committing to a full catalog contract. The quality of the pilot output — model accuracy, platform performance, client-facing interface quality — will tell you more than any vendor demonstration can.
Phase 3 — Content Creation and Preparation
Commission 3D models for your priority product selection, establish the metadata structure (product name, SKU, dimensions, material options, pricing) that the platform requires, and build the room setting environments in which products will be displayed in context.
The room setting environments deserve careful investment — they are the visual context that makes products compelling rather than clinical. A luxury sofa displayed in a thoughtfully staged living room environment with appropriate lighting, complementary furniture, and architectural detail will generate dramatically more engagement than the same sofa displayed against a neutral background.
Phase 4 — Launch and Optimization
A soft launch with 20–30% of your most engaged clients before full rollout allows you to gather real user feedback and identify any friction points in the client experience before they affect a wider audience.
The most common soft launch findings are: navigation elements that are intuitive to the internal team but confusing to first-time users; AR performance issues on specific device models; and pricing display that works in the internal team’s market context but is formatted incorrectly for international clients.
Phase 5 — Continuous Improvement and Scaling
Visualization technology is not a set-and-forget implementation. Platform capabilities advance rapidly — new AR features, improved rendering quality, enhanced configurator functionality — and staying current with those advances as the technology matures is an ongoing investment that compounds the competitive advantage of early adoption.
Schedule a quarterly review of platform performance data, client feedback, and competitive landscape. The businesses that treat their visualization infrastructure as a living competitive asset rather than a completed project are the ones that maintain durable differentiation.
Why Visualization Technology Is No Longer Optional
The data on visualization technology’s commercial impact in the furniture sector is no longer preliminary: 94% higher conversion rates for products with 3D/AR content. 25–40% reduction in return rates. Up to 30% reduction in sales cycle length. These are not optimistic projections — they are measured outcomes from businesses that have implemented these tools at operational scale.
The competitive pressure is equally unambiguous. Direct-to-consumer furniture brands have built visualization capability into their foundation. The most sophisticated B2B buyers — hotel development companies, large interior design practices, commercial fit-out specialists — are actively selecting distribution partners based on their ability to support digital-first specification workflows.
The question is no longer whether to implement visualization technology but how to do it well enough to generate the commercial outcomes the investment justifies.
Taking Action to Transform Your Business
The practical starting point is smaller than most businesses expect. A catalog of 50 priority products with professional 3D models, a web-based AR access point deployed through your product pages, and a sales team trained to use these tools in client-facing consultations represents a minimum viable implementation that generates measurable commercial impact within 3–6 months of launch.
From that foundation, the catalog expands, the platform capabilities deepen, and the client workflows that incorporate visualization become the new normal — producing compounding returns on the initial investment.
JL&C Furniture works with distributors, showroom operators, and design professionals across global markets to support exactly this kind of digital-first specification process, providing the product assets, technical documentation, and customization flexibility that visualization-enabled sales workflows require. Explore the complete collection and discuss how to integrate it into your omnichannel sales strategy.
1. What’s the difference between 3D visualization and AR, and which should we implement first?
3D visualization creates accurate digital models viewable from any angle on a screen — think of it as a complete, interactive digital replica of the product. AR (Augmented Reality) overlays those digital models into a real physical space through a smartphone or tablet camera, allowing the client to see the piece at actual scale in their actual room. The implementation sequence that works for most B2B furniture businesses is 3D first, AR second — because AR requires 3D models to function, so the catalog digitization work done for 3D directly enables AR as a subsequent capability. Interior designers and procurement teams often derive the most immediate value from 3D, while end-clients and hospitality buyers respond most powerfully to AR’s spatial placement capability.
2. How much does it cost to create 3D models of our product catalog?
Production costs for furniture 3D models currently range from approximately $150–$300 per model for standard catalogue pieces (chairs, tables, sofas in fixed configurations), to $500–$1,500 for complex or highly detailed pieces with multiple material configurations. Most distributors begin with 50–100 priority products, representing an initial investment of $7,500–$50,000 depending on model complexity. Outsourcing to a specialized 3D studio is typically more cost-effective than building in-house capability for businesses without existing 3D production infrastructure. Many businesses are now requiring manufacturers to supply 3D model assets as a standard condition of new product onboarding — which shifts the creation cost upstream and builds the catalog sustainably over time.
3. Can visualization tools integrate with our existing e-commerce platform?
Yes — the major visualization platforms designed for furniture distribution (Cylindo, VividWorks, Marxent, iEnhance) are built to integrate with standard e-commerce platforms including Shopify, WooCommerce, and Magento, as well as custom platforms through API connections. Integration timelines typically run 2–8 weeks depending on your system’s complexity and the quality of your existing product data. The critical prerequisite is a clean, consistent product database — SKU identifiers, dimensions, and material specifications must be structured and accurate before integration, because visualization tools surface any data quality issues immediately. Choose vendors who can demonstrate previous integrations with your specific platform stack.
4. How do we handle product customization and variations in 3D models?
Most advanced visualization platforms support parameterized (configurable) 3D models — a single model that dynamically updates as the user selects different fabric options, finishes, dimensions, or configurations. This is the correct approach for furniture products with multiple variants, because it allows a single 3D asset to serve the full configuration range rather than requiring separate models for each variant. The additional modeling cost for parameterization (typically 30–60% above a fixed-configuration model) is almost always justified by the client experience improvement and the elimination of the “can you show me it in the other fabric?” email cycle. Prioritize parameterized models for your highest-customization products.
5. What’s the typical adoption rate when we launch visualization tools for our clients?
Initial adoption among existing clients typically runs 15–25% in the first month, growing to 40–60% within 6 months as awareness spreads through client referral and as your sales team integrates the tools into standard consultation workflows. The adoption curve varies significantly by client segment: interior designers and tech-forward procurement teams adopt within the first month, while traditional buyers who have established working patterns may need 2–3 direct introductions before independently using the tools. The most effective adoption accelerator is personal introduction by a trusted sales representative during a live consultation, rather than a marketing email announcing the new capability.
6. How accurate do AR visualizations need to be for commercial hospitality projects?
For commercial specifications — hotel rooms, restaurant environments, corporate offices — dimensional accuracy within 2–5% of actual is the practical standard that most AR platforms achieve with modern smartphones. This accuracy is sufficient to make confident proportion and scale decisions, but should not be used as a substitute for measured verification in final specification sign-off. Best practice is to use AR to confirm design intent and eliminate obvious proportion mismatches at the selection stage, then use dimensional drawings for final specification confirmation. Always include a disclaimer in your AR-assisted proposals noting that physical verification is recommended before confirming custom or large-scale orders.
7. Can visualization tools reduce our physical showroom footprint?
Yes, and this is an increasingly common strategy among forward-thinking furniture businesses. The optimal hybrid model maintains a smaller, curated physical space focused on premium material and tactile evaluation — the sensory experience that digital visualization cannot replicate — while using digital showrooms and AR for product discovery, configuration exploration, and specification support. This model reduces overhead costs while actually improving the client experience, because physical showroom visits become higher-quality, more focused consultations rather than comprehensive product browsing sessions. Businesses that have implemented this hybrid model typically report 20–35% reductions in physical showroom costs alongside improved client satisfaction scores.
8. How do we measure whether visualization tools are actually improving conversion rates?
Establish a pre-implementation baseline of your key metrics (conversion rate, average order value, sales cycle length, return rate) for the 12 months before launch. After launch, use UTM parameters (tracking codes added to URLs that identify the traffic source) in visualization tool links to attribute client sessions to downstream orders. Where possible, run structured comparison analysis — comparing conversion rates for clients who engaged with visualization tools against those who didn’t, for the same product range during the same period. CRM (Customer Relationship Management) systems that timestamp the visualization engagement events within the deal timeline allow direct measurement of sales cycle compression attributable to the technology.
9. How quickly can new products be added to visualization tools after launch?
With an established 3D modeling pipeline and vendor relationship, new products can typically be added within 1–2 weeks of receiving the product’s technical specifications and dimensional drawings. Without an established pipeline, the timeline extends to 4–6 weeks. The most efficient approach is to build 3D model production into your new product onboarding process — requiring 3D assets (or the dimensional data needed to produce them) from manufacturers at the time of product sourcing approval. This ensures the catalog grows automatically as you add new products, rather than requiring catch-up digitization campaigns.
10. Are there privacy or data security concerns with AR visualization tools?
AR tools that use spatial mapping — analyzing room dimensions and surfaces through the device camera — do collect environmental data. For B2B applications, where the “room” being scanned may be a client’s commercial premises, hotel property, or private residence, this data collection should be addressed transparently in your terms of use. Choose visualization platforms with SOC 2 Type II or ISO 27001 security certifications, which provide audited assurance of data security practices. Ensure your platform’s data handling complies with GDPR if you serve European clients and CCPA for California. Most enterprise-grade visualization platforms are built for these compliance requirements, but review their data processing agreements before contractual commitment.
This guide is produced by JL&C Furniture — a Shanghai-based manufacturer of premium neo-classical and modern furniture serving distributors, interior designers, hotel developers, and commercial project buyers worldwide. Additional resources: Shopify AR Commerce Research | UL GREENGUARD Product Database | FSC Certification Verification | JL&C Dining Chair Collection | JL&C Hotel & Hospitality Furniture

China Furniture Sourcing Agent Roles for High-End Buyers What a China Furniture Sourcing Agent Actually Does for High-End Buyers Every finished luxury room sits on
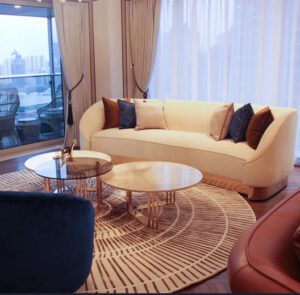
How to Vet a China Furniture Sourcing Agent Before Signing A single curved sofa like this goes through dozens of approvals, including frame, foam, fabric

China Furniture Sourcing Agent vs Direct Factory Buying: A Strategic Guide for High-Value Buyers When one project includes 400 hotel rooms, a 20-seat marble dining
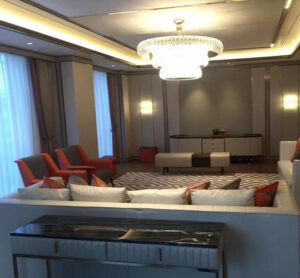
Advanced Tips to Get More from Your China Furniture Sourcing Agent Powerful Strategies for High-Performance Sourcing – Tailored for Elite Buyers, Designers & Operators Your
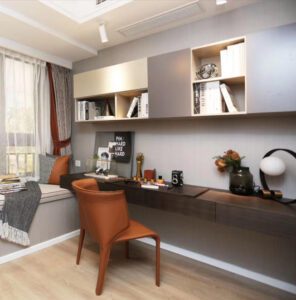
What Wholesale Furniture Suppliers in China Can Offer High-Value Buyers A statement luxury living room — the kind of space that begins with the right

How to Work Better With Your China Furniture Supplier After Ordering A Practical Playbook for High-End Furniture Importers, Interior Designers, FF&E Buyers, Villa Owners, Private